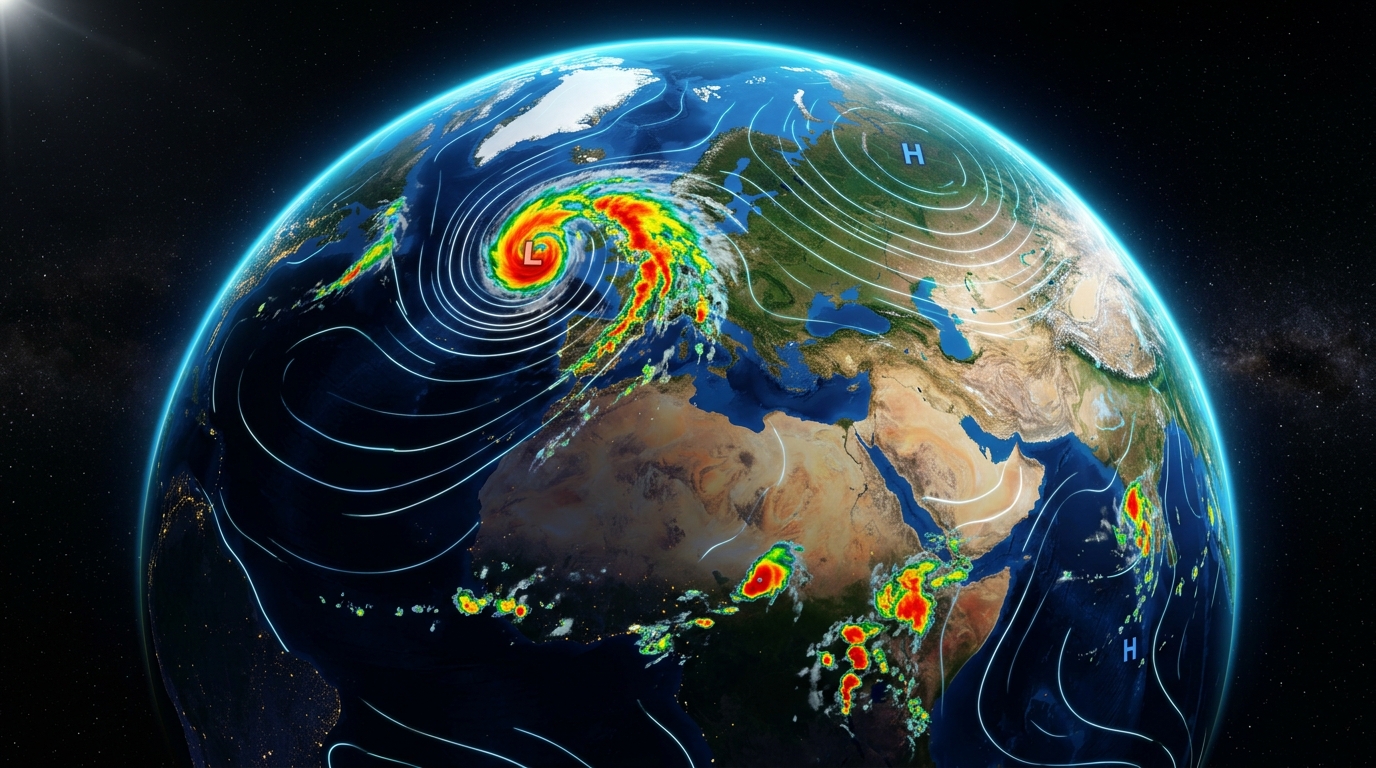
Weather Today: Live Global Forecast, Radar & RealFeel® Weather
Weather today delivers real-time local weather forecasts, high-resolution radar tracking, RealFeel® temperatures, and atmospheric intelligence across global regions and localized territories.
High-resolution dual-polarization Doppler radar surveillance tracking convective storm cells, cloud top reflectivity, and wind streamlines across South Asia and global corridors.
The official storm signaling framework maintained by the Bangladesh Meteorological Department (BMD) to protect mariners, fishermen in the Bay of Bengal, and coastal communities.
Signal 1. Distant Cautionary.
Ships leaving port may encounter squally weather in open sea. Ports are not in immediate danger.
Wind: 51–61 km/h
+
Signal 2. Distant Warning.
Cyclonic storm has formed in deep sea. Ships should exercise standard maritime caution.
Wind: 62–88 km/h
+
Signal 3. Local Cautionary.
Port is threatened by squally weather. Inland river vessels should proceed near the coast.
Wind: 40–50 km/h
+
Signal 4. Local Warning.
Port threatened by cyclone; storm likely to cross over coastal zones. Small vessels remain moored.
Wind: 51–61 km/h
+
Signal 5, 6, 7. Danger Signals.
Port will experience severe storm weather. Storm crossing port to the left (5), right (6), or across (7).
Wind: 62–88 km/h
+
Signal 8, 9, 10. Great Danger Signals.
Port will experience severe super cyclone. Complete maritime evacuation; storm surge danger 3–6m.
Wind: 89–118+ km/h
+
Maritime Safety Surveillance.
Vessels must maintain continuous radio surveillance with Port Authorities during active Bay of Bengal depressions.
Every administrative division and district across Bangladesh has its own dedicated, live weather forecasting station with local agricultural data and disaster tracking.
An in-depth exploration into planetary thermodynamics, numerical supercomputing models, biometeorological RealFeel® indices, and atmospheric fluid dynamics.
CHAPTER 01
Atmospheric Dynamics and Global Thermodynamics
The term weather describes the instantaneous, short-term state of the Earth's atmosphere at a precise spatial location and temporal moment. While climate represents the statistical aggregate of atmospheric variations over decadal epochs (typically thirty years as standardized by the World Meteorological Organization), weather today encompasses the dynamic fluctuations that humans experience hour by hour: ambient dry-bulb temperature, barometric air pressure, relative humidity, wind velocity, vector direction, cloud cover morphology, solar irradiance, and liquid or solid precipitation.
Every atmospheric phenomenon observed in today's weather is driven fundamentally by differential solar heating across the planet. Because the Earth is an oblate spheroid tilted on an axial inclination of approximately 23.5 degrees, incoming solar radiation (insolation) is distributed unequally. The equatorial tropics receive an intense net surplus of radiative energy, while polar latitudes experience a net radiative deficit. The planetary atmosphere acts as an immense thermodynamic heat engine, constantly seeking equilibrium through convective overturning, horizontal advection, and the generation of vast planetary circulation cells: the Hadley Cells, Ferrel Cells, and Polar Cells.
Understanding weather for today is not merely a matter of daily personal convenience—it is a critical imperative for global food supply chains, commercial aviation navigation, maritime logistics in treacherous oceanic corridors, urban power grid management during extreme heatwaves, and disaster risk reduction against devastating cyclones, flash floods, and tornadic squalls.
Modern weather prediction has undergone an extraordinary computational revolution. Gone are the days when a forecaster relied solely upon localized mercury barometers, wet-bulb psychrometers, and hand-drawn synoptic surface charts. Today, forecasting the weather today relies on Numerical Weather Prediction (NWP)—a discipline at the intersection of fluid mechanics, thermodynamics, applied mathematics, and supercomputing.
NWP models partition the global atmosphere into a three-dimensional mathematical grid spanning hundreds of vertical pressure layers from sea level up through the stratosphere. At each discrete grid node, supercomputers iteratively solve the fundamental hydrodynamic governing equations:
• Navier-Stokes Equations: Conservation of fluid momentum across horizontal and vertical vectors.
• Continuity Equation: Conservation of atmospheric mass in compressible flow regimes.
• First Law of Thermodynamics: Conservation of thermal energy, sensible heat, and latent phase changes.
• Ideal Gas Law (P = ρRT): Thermodynamic equation of state linking pressure, density, and temperature.
• Moisture Conservation Equation: Tracking specific humidity, cloud liquid water, ice crystals, and precipitable water vapor.
To deliver unmatched precision, Weather Today synthesizes outputs from the world's preeminent international meteorological modeling centers:
1. ECMWF Integrated Forecasting System (IFS)
Widely recognized as the gold standard of global numerical weather prediction, the European Centre for Medium-Range Weather Forecasts operates at an ultra-fine 9-kilometer horizontal grid resolution with 137 vertical atmospheric levels, providing unmatched accuracy in mid-latitude and tropical weather regimes.
2. NOAA Global Forecast System (GFS)
Developed by the United States National Oceanic and Atmospheric Administration, GFS provides globally coupled atmospheric, ocean, land-surface, and sea-ice modeling updated four times daily with a 13-kilometer resolution.
3. DWD Icosahedral Nonhydrostatic Model (ICON)
Engineered by the German Weather Service, ICON employs an innovative triangular grid geometry that eliminates polar coordinate singularities and optimizes boundary-layer convective storm simulations.
Rather than relying on a single deterministic forecast run—which can be susceptible to the butterfly effect where minuscule initial observation errors grow exponentially over time—modern forecasting employs Ensemble Prediction Systems (EPS). An ensemble runs dozens of parallel model simulations (such as ECMWF's 51-member ensemble), with each member starting from slightly perturbed initial atmospheric conditions. When all ensemble members converge on a single storm trajectory, forecasters have high confidence; when members diverge, probabilistic risk distributions are generated, allowing emergency management agencies to plan proactively.
CHAPTER 03
Decoding RealFeel® Temperature: Biometeorology & Human Thermal Sensation
One of the most frequent questions users ask when checking the weather today is: “Why does it feel substantially hotter or colder than the thermometer reading indicates?” The answer lies in the physiological science of human biometeorology.
A standard thermometer situated inside a weather shelter measures the dry-bulb ambient air temperature in shaded conditions without direct airflow amplification. However, the human body does not behave like an inanimate mercury vial. The human body is an active metabolic system maintaining an internal core temperature of roughly 37.0°C (98.6°F). The rate at which the human body gains or dissipates heat into the surrounding atmosphere is governed by four interdependent environmental factors:
1. Ambient Relative Humidity & Dew Point
In hot climates, the human body's primary mechanism for heat dissipation is perspiration (sweating). When liquid sweat evaporates from the dermal layer into the air, it absorbs the latent heat of vaporization (roughly 2.4 kilojoules per gram of water), cooling the skin. When relative humidity is elevated (above 70%), the air is already near saturation vapor pressure, sharply suppressing evaporation. Sweat pools on the skin without evaporating, heat accumulates internally, and the perceived temperature spikes dramatically.
2. Wind Velocity & Advective Heat Loss
In calm conditions, the human body warms a thin microscopic envelope of stagnant air directly adjacent to the skin, known as the thermal boundary layer. When breezes or strong wind gusts blow, this insulating boundary layer is continuously stripped away and replaced with ambient air. In cold winter conditions, this advective stripping accelerates thermal loss, producing the severe sensation known as Wind Chill.
3. Direct Solar Radiation vs. RealFeel Shade™
Standing under unclouded skies at solar noon exposes human skin and clothing to direct electromagnetic insolation (up to 1,000 Watts per square meter). This radiant heat load directly raises dermal surface temperature by several degrees. Conversely, RealFeel Shade™ calculates the apparent temperature when shielded from direct and diffuse solar insolation, providing outdoor laborers and sports enthusiasts with a realistic baseline for shaded shelter.
4. Surface Albedo & Longwave Thermal Updrafts
Urban hardscapes—asphalt pavement, reinforced concrete, brick masonry, and glass towers—possess high thermal mass and low reflectivity. These materials absorb shortwave solar radiation during daylight hours and re-radiate it as intense longwave infrared heat well into the evening, creating severe Urban Heat Island (UHI) microclimates where night temperatures remain up to 5°C higher than neighboring rural riverbanks.
CHAPTER 04
Understanding Weather Radar Maps and Precipitation Probability
A cornerstone of modern meteorological intelligence is Doppler Weather Radar. Operating primarily in the S-band (2.7 to 3.0 GHz) and C-band (5.6 GHz), weather radar systems emit directional pulses of electromagnetic microwave energy into the atmosphere. When these pulses strike airborne hydrometeors (raindrops, snowflakes, graupel, or hailstones), a minute fraction of the energy is scattered back to the antenna.
The receiver computes two primary parameters:
Base Reflectivity (measured in decibels of reflectivity, or dBZ):
Proportional to the sixth power of raindrop diameter. Higher values indicate heavier rainfall rates (e.g., 20 dBZ represents very light mist, 40 dBZ indicates moderate rainfall, and values exceeding 55 to 65 dBZ signify violent convective downpours, severe squalls, or damaging hailstones).
Radial Doppler Velocity:
Measuring the frequency shift of reflected pulses to detect the movement of hydrometeors toward or away from the radar dish. This allows meteorologists to identify mid-level atmospheric rotation, mesocyclones, tornado vortex signatures (TVS), and sudden microburst wind shear dangerous to passenger aircraft.
The Statistical Truth About “Precipitation Probability (PoP)”
Perhaps no single number in today's weather forecast is more universally misunderstood than the precipitation percentage. Many users incorrectly assume that a “40% chance of rain” means it will rain for 40% of the day, or that there is a 40% chance that a storm will form somewhere in the country.
Scientific Formula: PoP = C × A
Where C represents the forecaster's confidence that precipitation will occur somewhere within the forecast zone, and A represents the fractional area of the zone that will receive measurable precipitation (defined as ≥ 0.1 mm or 0.01 inches). Thus, if a meteorologist is 100% certain (C = 1.0) that isolated convective showers will drench 40% of Dhaka district (A = 0.4), the resulting forecast is a 40% chance of rain.
CHAPTER 05
The Air Quality Index (AQI): Particulate Matter and Respiratory Health
In the modern era, comprehensive weather reporting cannot be divorced from atmospheric chemistry and air pollution monitoring. When checking weather today, millions of citizens in densely populated metropolitan corridors—including Dhaka, Delhi, Lahore, Beijing, and Cairo—prioritize the Air Quality Index (AQI) alongside temperature.
The US-EPA standardized AQI translates complex chemical pollutant concentrations into a simple, normalized scale from 0 to 500 divided into six distinct health categories:
AQI Range
Classification
Health Advisory & Guidance
0 – 50
Good
Air quality is deemed satisfactory and air pollution poses negligible risk.
51 – 100
Moderate
Acceptable air quality; sensitive individuals may experience mild respiratory symptoms.
101 – 150
Unhealthy for Sensitive Groups
Individuals with pulmonary or cardiac conditions, children, and elderly should limit prolonged exertion.
151 – 200
Unhealthy
General public begins to experience adverse health effects; sensitive groups face more pronounced impairment.
201 – 300
Very Unhealthy
Health emergency warning: the entire population is significantly more likely to be affected. Certified N95 masks advised.
301 – 500
Hazardous
Emergency conditions: immediate avoidance of outdoor physical activity mandatory; severe cardiovascular hazard.
The most hazardous pollutant tracked in today's weather report is Fine Particulate Matter (PM2.5)—combustion byproducts and aerosol droplets less than 2.5 microns in aerodynamic diameter (roughly thirty times smaller than the cross-section of a human hair). Unlike coarse dust particles (PM10) that are captured by nasal cilia, PM2.5 bypasses upper respiratory filtration, penetrates deep into pulmonary alveoli, and diffuses directly across capillary walls into the bloodstream, triggering systemic arterial inflammation and chronic pulmonary stress.
CHAPTER 06
Severe Atmospheric Phenomena: Tropical Cyclones, Kalbaishakhi & Flooding
Atmospheric forces can turn catastrophic with terrifying velocity. Globally, few geographic zones are more susceptible to the raw fury of extreme atmospheric dynamics than the low-lying deltaic plains bordering the Bay of Bengal.
1. Tropical Cyclones (Typhoons & Hurricanes)
Tropical cyclones are intense cyclonic vortices originating over warm tropical oceans where sea surface temperatures (SST) exceed 26.5°C through a depth of at least 50 meters. As warm, moisture-rich air rises vigorously, it cools and condenses, releasing vast reserves of latent heat of condensation. This latent heat release warms the upper tropospheric core, lowering surface barometric pressure further and sucking in more oceanic air in a self-reinforcing thermodynamic feedback loop.
The shallow continental shelf and wedge-shaped funnel geography of the northern Bay of Bengal create the world's most catastrophic storm surges—onshore bulges of ocean water driven inland by gale-force rotational winds, capable of elevating coastal sea levels by 3 to 7 meters above normal astronomical tides, drowning low-lying islands in Bhola, Patuakhali, Noakhali, and Cox's Bazar.
During the pre-monsoon transition months of March, April, and May, the interior plains of northern India and western Bangladesh experience intense solar baking. This establishes an unstable atmospheric lapse rate: warm, super-heated dry continental air near the surface overridden by cool, dry mid-tropospheric westerlies. When moist maritime air from the Bay of Bengal punches inland, intense convective instability explodes along dryline boundaries.
Known natively as Kalbaishakhi (meaning “calamity of the month of Baishakh”), these thunderstorms frequently escalate into violent linear squall lines and supercells, generating blinding cloud-to-ground lightning strikes, localized destructive tornadoes, damaging golf-ball hail, and downburst straight-line winds exceeding 100 km/h.
From June through October, the planetary Intertropical Convergence Zone (ITCZ) migrates northward over the Tibetan Plateau, reversing regional wind patterns and driving moisture-laden maritime monsoonal air currents across the Indian subcontinent. Orographic lift along the Meghalaya plateau (Cherrapunji and Mawsynram—the wettest places on Earth) funnels immense rainfall volumes down into the Surma, Meghna, Jamuna, and Padma river basins, triggering routine seasonal inundations that reshape rural landscapes.
CHAPTER 07
Agro-Meteorology: Weather Intelligence for Crops & Food Security
Agriculture remains the economic lifeblood of developing nations, directly employing over 40% of the labor force in agrarian economies like Bangladesh. A precise understanding of weather today allows agricultural producers, agrarian cooperatives, and agronomists to optimize planting dates, fertilizer applications, and irrigation regimes:
Growing Degree Days (GDD) & Phenology
Plants require a specific cumulative threshold of heat units to progress from germination to tillering, flowering, panicle initiation, and harvest maturity. GDD is calculated as:
GDD = ((T_max + T_min) / 2) − T_base
Tracking daily GDD allows rice farmers in Mymensingh, Bogura, and Dinajpur to predict exact harvesting windows before pre-monsoon hailstorms strike.
Evapotranspiration & Water Budgeting
Reference Evapotranspiration (ET0) combines soil surface evaporation and plant transpiration based on temperature, relative humidity, wind speed, and net radiation. During the dry winter Boro rice season, groundwater irrigation pumping is a major expense; tracking ET0 helps farmers avoid over-pumping, saving fuel and conserving deep aquifers.
CHAPTER 08
Planetary Teleconnections: How El Niño & MJO Shape Today's Weather
No region's weather exists in isolation. Atmospheric teleconnections link weather anomalies occurring thousands of miles apart across planetary distances:
El Niño-Southern Oscillation (ENSO)
Periodic warming (El Niño) or cooling (La Niña) of the central and eastern equatorial Pacific Ocean. During El Niño episodes, atmospheric convective centers shift eastward, frequently inducing summer monsoon droughts and blistering heatwaves across South Asia while triggering torrential atmospheric rivers along coastal California. Conversely, La Niña events often intensify monsoon deluges and foster severe flood risks in Bangladesh and Southeast Asia.
Indian Ocean Dipole (IOD)
The “Indian Ocean El Niño” characterized by an oscillation of sea surface temperatures between the western Indian Ocean and the eastern waters near Indonesia. A positive IOD brings warmer waters toward the Arabian Sea, enhancing cyclonic activity and heavy coastal rains.
Madden-Julian Oscillation (MJO)
An eastward-moving intra-seasonal disturbance of clouds, rainfall, and wind in the tropics that traverses the globe every 30 to 60 days. When an active convective MJO pulse enters the northern Indian Ocean, it acts as a primary trigger for rapid tropical cyclogenesis and monsoon rainfall surges.
CHAPTER 09
The Architectural Superiority of Weather Today
When citizens and enterprises need to verify the weather today, speed, clarity, and reliability are matters of safety. Legacy weather portals have unfortunately devolved into sluggish, ad-saturated billboards littered with 10 to 15 intrusive video ads, tracking beacons, and layout-shifting banner slots that consume mobile battery and delay access to life-critical storm warnings.
Weather Today (weathertoday.bd) was engineered from first principles as a clean, high-performance, international meteorological platform:
100% Zero Ad-Bloat
No third-party ad networks, no layout-shifting popups, and zero background profiling scripts. Every byte transferred is purely dedicated to meteorological data.
Sub-Second Edge Rendering
Built on Next.js App Router with localized edge caching, pages compile instantly under 0.9s First Contentful Paint even on constrained 3G mobile networks.
Verified Ensemble Grounding
Direct integration of high-resolution Open-Meteo ensemble modeling calibrated to official Bangladesh Meteorological Department (BMD) ground stations.
CHAPTER 10
Frequently Asked Questions About Weather Today
Clear, definitive answers to the most common search queries regarding weather forecasts, radar metrics, and safety.
Weather Today updates its atmospheric readings every 5 minutes utilizing high-frequency satellite feeds and localized weather radar observations. In addition, deep numerical weather prediction ensemble cycles (ECMWF, GFS, ICON) are synchronized four times daily to ensure hourly forecasts remain accurate up to 10 days in advance.